


Articles
Driver-Based Budgeting: Turning Customer Demand into Better Decisions
- By Noah Navarro, Strategic FP&A, Integrated Supply Chain, Honeywell
- Published: 8/12/2026

Driver-Based Rolling Forecasts in Complex Environments
After 20 years in finance, I have learned that a forecast is only as valuable as the decisions it helps a business make. At Honeywell, I led financial planning for a high-mix, low-volume global division. To maintain speed and flexibility and avoid getting trapped in thousands of transactions, I used a 12-month driver-based rolling forecast focused on the key operational factors that drive sales, costs and margins.
However, while a driver-based rolling model can quickly project the numbers, it cannot tell you why the numbers are changing or what management should do about it. That is why Honeywell combines monthly rolling forecasts with deeper quarterly reviews across finance, operations, sales, supply chain and other functions. The rolling forecast provides speed, while the quarterly review provides context.
The goal is simple: forecast early, understand the drivers, anticipate and act before variances become a problem.
1. Starting with Demand
In my experience, driver-based forecasting starts with one question:
What is driving demand?
How that demand is captured depends on the complexity of the business and the maturity of its planning systems.
Early in my career, I worked in environments where customers provided their own sales forecasts directly. In larger and more complex organizations such as Honeywell, Parker Hannifin, Thermo Fisher and GE, demand was typically developed through formal S&OP (Sales & Operations Planning) or SIOP (Sales, Inventory, Operations and Planning) processes.
This distinction matters. Finance should not be reinventing the sales forecast every month. The demand plan should come from the people closest to the customer and the operation, with finance challenging the assumptions and translating them into a financial forecast.
A strong S&OP or SIOP process provides finance with a consolidated demand baseline while retaining the customer detail underneath it. It delivers speed, customer insights and accountability.
2. Building and Maintaining Ratios
Once demand is established and agreed upon, the rest of the P&L begins to flow from a series of operating relationships. Historical performance provides the starting point, and ratios translate volume into revenue, cost and margin.
One of the biggest mistakes FP&A can make is treating historical ratios as facts.
Ratios are living assumptions, not fact-fixed formulas.
Pressure Testing Data
A historical labor rate may change because of wage inflation. Material costs may change because of commodity prices. SG&A may not scale proportionally with revenue. Gross margin may move because the product mix changes.
Finance must constantly challenge the relationships behind the model and match the forecast to operational reality.
For example, if a model projects 20% volume growth, FP&A must immediately ask:
- Do we have the capacity to produce it?
- Should SG&A scale?
- Does the product mix support the expected margin?
- What happens if orders are delayed?
Understanding Product, Customer or Regional Mix
In my experience, some of the most difficult and important forecasting assumptions involve mix. While there are several types, I always emphasize three critical ones:
- Product Mix: Different products can have dramatically different margin profiles.
- Customer Mix: Pricing, discounts, payment terms, volume tiers and service requirements can materially change profitability.
- Regional Mix: Foreign exchange, local pricing, freight, competitive pressure and market conditions can create significant differences in economics across geographies.
Mix is often the hidden explanation behind a margin variance. That is why I always challenge my team to answer a better question:
What did we sell, to whom, where and at what price?
Maintaining Ratio Integrity
Building ratios is only half the effort. Maintaining them requires systematic discipline.
Each month, finance should compare forecast ratios to actual performance and strip out one-time distortions to determine whether the underlying relationship has changed.
The objective is not to update the model every week. It is to know when an assumption has changed and why.
3. Driving Action and Accountability (The Rail)
Forecasting without execution is just modeling.
One of Honeywell’s practices for connecting the forecast to execution is a Rolling Action Item List (RAIL). The RAIL is a live inventory of actions that management can take as business conditions change. It turns the forecast from a passive financial document into an operating tool.
The basic question is:
If sales move, what are we going to do about it?
The RAIL should contain actions on both sides of the forecast. For instance, what should we do if demand increases/decreases?
The important point is that actions should be identified before they are needed.
4. The Role of Systems and Operational Data
At Honeywell, Hyperion served as the enterprise consolidation platform. Business units submitted forecasts through the system, while much of the underlying driver-based modeling was performed in Excel.
Excel provided the flexibility to test assumptions and understand the relationships underneath the numbers. However, when something did not look right, finance needed to go deeper.
Validating assumptions requires work, but strong driver assumptions are ultimately based on a sound understanding of the operation. That operational understanding is what creates a forecast that management can trust.
5. Best Practices for Driver-Based Budgeting
For practitioners interested in implementing driver-based budgeting, I would emphasize a few practical lessons. The model has to be analytical, but it also has to reflect how the business actually operates.
The goal is not to become a ratio expert. The goal is to understand the drivers well enough to explain margin, earnings and the actions required to improve performance quickly.
- Ground Everything in Demand: Every major P&L line should connect to an understandable business driver (e.g., units sold, average price, headcount, labor rates, cost per unit, etc.).
- Establish a Clean Historical Baseline: Use enough historical data to distinguish trends from short-term noise. I generally recommend at least 18 months of clean history, with adjustments for significant changes in the business.
- Strip Out One-Time Events: Do not allow non-recurring items to distort the baseline (e.g., tax credits, catch-up depreciation, tariffs).
- Master Portfolio Mix: Pay particular attention to product, customer and regional mix. Mix drives margin and margin drives earnings. Remember: Mix is often the hidden explanation behind a margin variance.
- Integrate Management Judgment: The driver-based rolling model should establish the baseline. It should not replace judgment. Management still needs room to incorporate strategic investments, competitive dynamics, market intelligence, customer behavior and known business events.
- Use Review Meetings as a Control: Healthy disagreements between finance and business leaders are one of the most effective controls an organization can have. Finance should always be willing to ask uncomfortable financial questions.
- Respect Complexity Limits: The answer is not necessarily to abandon the driver-based rolling forecast. It is to recognize where additional detail and management judgment are needed.
6. Conclusion: Make the Driver-Based Forecast a Management Tool
The ultimate objective of driver-based forecasting is to provide a faster connection between what is happening in the business, what it could financially mean for the rest of the year and what management should do next.
That is the real value of a driver-based rolling forecast.
It gives you enough visibility, using current trends, to take action before you miss your target.
Interested in learning more? The AFP interactive FP&A guide, A Better Budgeting Process, provides finance and FP&A professionals with strategic insights, best practices and actionable strategies to modernize budgeting and create greater value across the organization.
Copyright © 2026 Association for Financial Professionals, Inc.
All rights reserved.
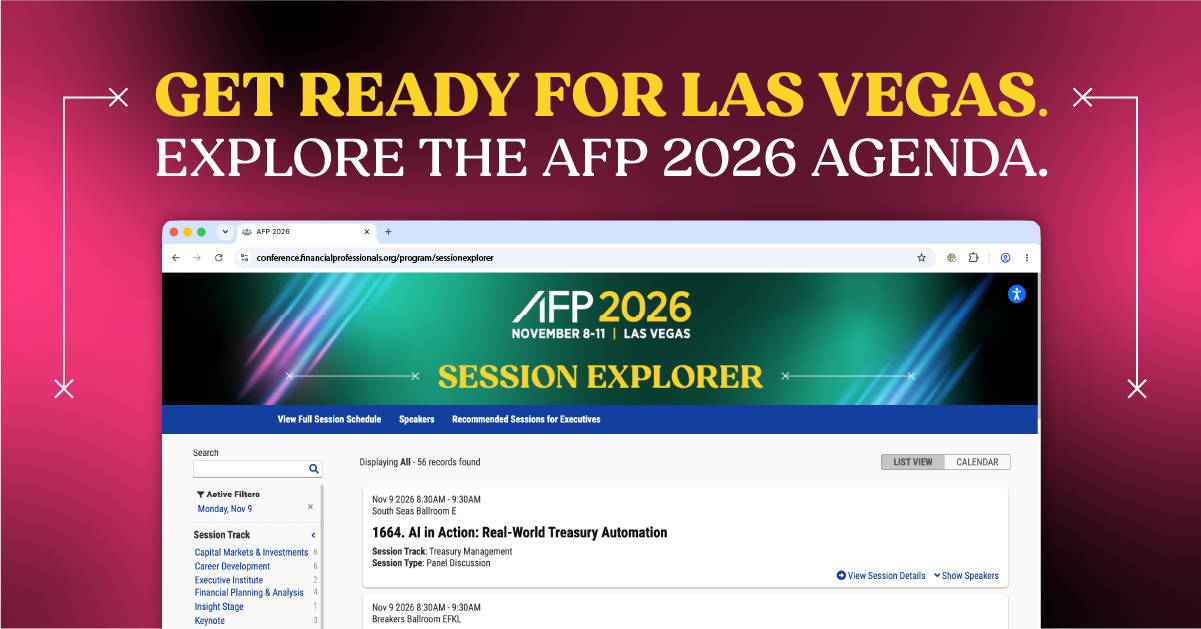
🔍 Browse 140+ sessions by day or track
💡 Discover the speakers sharing
real-world treasury and finance strategies
🤝 Find networking experiences designed
to help you connect with peers
📅 Build your plan before you arrive
Start Exploring
AFP Membership
The Hub for Treasury and Finance Professionals
As an AFP member, you'll gain access to exclusive training, certifications, research and networking to advance your career.
AFP Newsletters
Unbiased, practitioner-driven information for treasury and finance professionals
Subscribe to an AFP Newsletter to receive the latest news, events and trends in FP&A, Treasury or career planning.