Articles
Choosing the Right Statistical Method for Cash Forecasting
- By AFP Staff
- Published: 7/28/2025

Data-driven forecasting methods have become essential to the treasury toolkit. While approaches that draw on qualitative inputs can be useful for basic planning, statistical methods offer a more structured and objective approach to predicting future cash flows. By identifying patterns, relationships and trends in historical data, statistical methods enhance the accuracy of forecasts, making them repeatable, explainable and scalable.
For treasury professionals, selecting a cash forecasting methodology is a decision with significant implications. After all, cash forecasting is the foundation for managing liquidity, optimizing working capital and mitigating financial risks, and effective cash forecasting hinges on choosing the right method for the task.
This article explores some of the most common statistical methods used in cash forecasting, including time series forecasting methods and causal forecasting methods, and explains how to apply them correctly to both stationary and non-stationary data.
In This Article
- Visually Analyzing Your Data for Patterns and Stationarity
- Time Series Forecasting Methods
- Causal Forecasting Methods
- Comparison of Statistical Forecasting Methods
- Choosing the Right Statistical Method for Your Needs
Download a Cheat Sheet
Fill out the form below to download a complimentary cheat sheet on the key things you need to know when choosing a statistical method for cash forecasting.
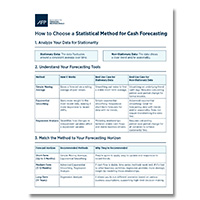
Visually Analyzing Your Data for Patterns and Stationarity
Before forecasting, you must first determine whether your data is stationary, meaning there is no long-term directional movement in the data over time, or non-stationary. This distinction is crucial for selecting the appropriate forecasting method and ensuring it is being applied correctly.
To start, create a simple line chart and look for these four main types of patterns:
- Trends show the general direction of your data, such as sales steadily increasing each quarter.
- Seasonal patterns are predictable fluctuations that occur at the same time every year, for example, a spike in cash outflows for annual bonus payments or higher revenue during the holiday season.
- Cyclical patterns are tied to broader economic or business cycles, rather than the calendar, and are, therefore, longer-term and less predictable than seasonal patterns. An example of a cyclical pattern is the decrease in capital expenditures that typically occurs during a recession.
- Random movement is the unpredictable, irregular component that can’t be planned for, such as a sudden supply chain disruption caused by a natural disaster.
Identifying these patterns will help you check for stationarity:
- A stationary series will look relatively flat on a chart. The data points will fluctuate around a consistent mean, and the width of the fluctuations will be similar. The chart will not show any obvious trends or seasonality.
- A non-stationary series will contain a clear trend (points moving consistently up or down) or seasonality (predictable fluctuations).
Time Series Forecasting Methods
A time series is a set of numbers tracked over a regular interval of time, such as daily cash balances, biweekly payroll disbursements or monthly sales figures. The goal of time series analysis is to identify repeating patterns in a historical series that can be used to predict future values within the same series.
Two of the most common applications of time series forecasting techniques are the simple moving average and exponential smoothing.
Simple Moving Average (SMA)
A simple moving average (SMA) bases a forecast on a rolling average of past values, thereby creating a straightforward method for forecasting future values. Its greatest strength is its ease of use, especially when used with tools like Excel. It’s also able to filter out more random movement as the number of data points used to form the average increases.
However, its advantage is also a disadvantage, as SMA is slower to respond to changes in direction. Because SMA relies on historical averages, it can lag behind a trend and tends to smooth over sharp fluctuations, such as seasonal spikes.
Applying SMA to Stationary Data
SMA is an excellent tool for smoothing out random noise and providing a short-term forecast using stationary cash flow data.
For example, say you want to forecast cash collections for April using a three-month SMA:
| Month | Actual Collections |
|---|---|
| January | $100,000 |
| February | $110,000 |
| March | $105,000 |
Calculation: ($100,000 + $110,000 + $105,000) / 3 = $105,000
Your forecast for April would be $105,000.
Applying SMA to Non-stationary Data
Proceed with caution when using SMA with non-stationary data. While you can use SMA for trend visualization with non-stationary data, note that it will always lag the trend. To use SMA in a model that requires stationary data, you must first transform the non-stationary data by calculating the period-over-period change.
For example, consider this scenario where cash collections exhibit an upward trend.
| Month | Actual Collections (Non-stationary Data) | Monthly Change (Stationary Data) |
|---|---|---|
| January | $100,000 | |
| February | $102,000 | $2,000 |
| March | $105,000 | $3,000 |
| April | $106,000 | $1,000 |
To forecast the change in cash collections for May, you would apply the SMA to the Monthly Change column, which contains the stationary data:
($2,000 + $3,000 + $1,000) / 3 = $2,000
Exponential Smoothing
Unlike SMA, which treats all past periods equally, the exponential smoothing technique gives more weight to the most recent data, making it more responsive to recent shifts.
Applying Exponential Smoothing to Stationary Data
For stationary data, simple exponential smoothing (SES) provides a smoothed forecast that adapts more quickly than SMA. This technique uses a smoothing constant, often referred to as alpha (α), which determines how much weight to place on the most recent actual cash flow, compared to previous forecasts.
The SES formula is:
Next Period Forecast = (α × Actual Cash This Period) + [(1 – α) × Forecast for This Period]
Where α is the smoothing constant (0 < α < 1).
Alpha can be thought of as a lever for responsiveness:
- An alpha closer to 1 tells the model to place more weight on the most recent actual cash flow, allowing the forecast to react more quickly to changes. This is useful for volatile cash flows where the recent past is the best indicator of near-future performance.
- An alpha closer to 0 tells the model to place more weight on past forecasts, resulting in a more stable output that is less affected by short-term fluctuations.
Most forecasting software and treasury management systems (TMSs) include SES as a built-in function, allowing them to automatically select the alpha value that yields the most accurate forecast based on historical data.
As with SMA, SES can still lag behind a trend in the data. If the trend is relatively mild, the lag will be small because it’s using values from the current period. And of course, the closer the alpha is to one, the sooner a trend can be identified.
Applying Exponential Smoothing to Non-stationary Data
Exponential smoothing methods are particularly useful for handling non-stationary data. Rather than analyzing the period-over-period changes yourself, you can use an advanced version of exponential smoothing to project the underlying trend and seasonality in your data.
Two commonly used advanced methods of exponential smoothing are:
- Holt's Linear Trend Method, which models and forecasts data with a trend
- Holt-Winters' Seasonal Method, which models and forecasts data with both a trend and seasonality
Most modern treasury technologies include these methods, so you do not need to build these models manually:
- In Excel, use the Forecast Sheet function, located on the Data tab. Provide the time series of your historical data, and Excel will automatically detect whether the data is stationary or non-stationary, then apply the appropriate exponential smoothing method.
- In many TMS platforms with a cash forecasting module, the system is able to automatically analyze the data and apply the appropriate exponential smoothing method using its built-in statistical engine.
Causal Forecasting Methods
Causal forecasting methods, also known as associative forecasting methods, encompass a range of techniques that link cash flow to other business activities. While these methods can include advanced machine learning models that uncover complex, non-linear relationships, this section will focus on the most fundamental and widely used method: regression analysis.
Preparatory Step: Identify Potential Drivers with Correlation Analysis
Correlation analysis is a statistical tool that measures the strength and direction of a relationship between two variables. While correlation doesn’t imply causation, it is a valuable first step in narrowing down which variables to monitor more closely in your forecasting process. For example, by examining how closely your cash position tracks with sales, accounts receivable or inventory levels, you can identify the factors most strongly associated with cash movements.
When both variables are stationary, correlation analysis can reliably identify if a relationship exists between two variables. However, when working with non-stationary data, correlation analysis can result in a spurious correlation, where two unrelated variables appear to be highly correlated simply because they both have trends.
To analyze the underlying relationship between two variables with non-stationary data, you must first transform both sets of data by calculating their period-over-period change, then run the correlation analysis to see if there is a relationship between the changes in the variables.
Regression Analysis
Once you have identified potential drivers with correlation analysis, you can use regression analysis to quantify how changes in independent variables (such as days sales outstanding or inventory turns) affect a dependent variable (e.g., cash flow). To run a regression analysis, you need to first have sufficient historical data to establish a reliable relationship between the independent and dependent variables.
Applying Regression Analysis to Stationary Data
If all the variables are stationary, you can use regression analysis directly on the data. If you have a single driver, use simple linear regression. Follow the steps below to run a simple linear regression in Excel:
- Create two columns with your historical data: one for the independent variable and one for the dependent variable.
- Enable the Analysis ToolPak by navigating to File > Options > Add-ins > Excel Add-ins > Go. Check the Analysis ToolPak option, then click OK.
- Run the regression by going to Data > Data Analysis > Regression. For “Input Y Range,” select your dependent variable data. For “Input X Range,” select your independent variable data.
- Interpret the output, which will be broken out into various components. The equation for a simple linear regression model is: Dependent Variable = Y-intercept + (X Variable Coefficient * Independent Variable)
Cash flow is rarely driven by a single factor, so you will more likely use multiple linear regression to model the relationship between cash flow and several independent drivers simultaneously. This provides a more holistic and accurate forecast. To run a multiple linear regression in Excel:
- Create a column for your dependent variable and multiple adjacent columns for your independent variables.
- Enable the Analysis ToolPak by navigating to File > Options > Add-ins > Excel Add-ins > Go. Check the Analysis ToolPak option, then click OK.
- Run the regression by going to Data > Data Analysis > Regression. For “Input Y Range,” select your dependent variable data. For “Input X Range,” select all of your independent variable data.
- Interpret the output, which will show a coefficient for each driver. The formula for a multiple linear regression model expands accordingly: Dependent Variable = Y-intercept + (Coefficient_1 * Driver_1) + (Coefficient_2 * Driver_2) + …
Applying Regression Analysis to Non-stationary Data
Applying regression analysis, whether simple or multiple, directly to non-stationary variables can result in spurious regression, where the model incorrectly suggests a relationship between two or more unrelated variables. When working with non-stationary data, you must first transform your data by calculating the period-over-period change for your dependent variable and each of your independent variables. Then you can build a regression model using the transformed data.
Comparison of Statistical Forecasting Methods
| Method | Forecasting Approach | Best Use Case with Stationary Data | Best Use Case with Non-Stationary Data |
|---|---|---|---|
| Simple Moving Average | Time Series | Smoothing out noise to find a stable short-term average. | Visualizing an underlying trend (with lag). Requires calculating period-over-period change for formal models. |
| Exponential Smoothing | Time Series | Simple exponential smoothing: Responsive short-term forecasts for data with no trends. | Advanced exponential smoothing: Great for forecasting data with trends and/or seasonality. Does not require transforming the data first. |
| Regression Analysis | Causal | Modeling relationships between stable cash flows and stable business drivers. | Requires calculating period-over-period change for all variables to achieve stationarity first. |
Choosing the Right Statistical Method for Your Needs
Like most everything else in finance, there is no one-size-fits-all approach. Selecting the right statistical method for cash forecasting depends on the following key factors:
- Data availability: Do you have enough historical data to support more detailed analysis?
- Business complexity: How many variables influence your cash flow?
- Volatility: How often and how sharply do the cash flows fluctuate?
- Forecast horizon: Are you looking days ahead or planning for the next quarter or year?
For short-term forecasts (up to 3 months), less complex methods like simple moving averages or exponential smoothing are often adequate. They’re quick to apply, easy to update and responsive to recent trends.
For medium-term forecasts (3-12 months), if cash flow is stable and predictable, time series methods work well; however, if cash flow is closely tied to other business activities, causal forecasting methods, such as regression analysis, offer more strategic insights by modeling relationships.
For long-term forecasts (1+ years), causal forecasting methods are typically superior to time series methods, as they allow you to run scenarios, which support more strategic decision-making.
Ultimately, the best forecasting method is the one that aligns with your data, your business and the strategic decisions you’re trying to support.
Copyright © 2026 Association for Financial Professionals, Inc.
All rights reserved.